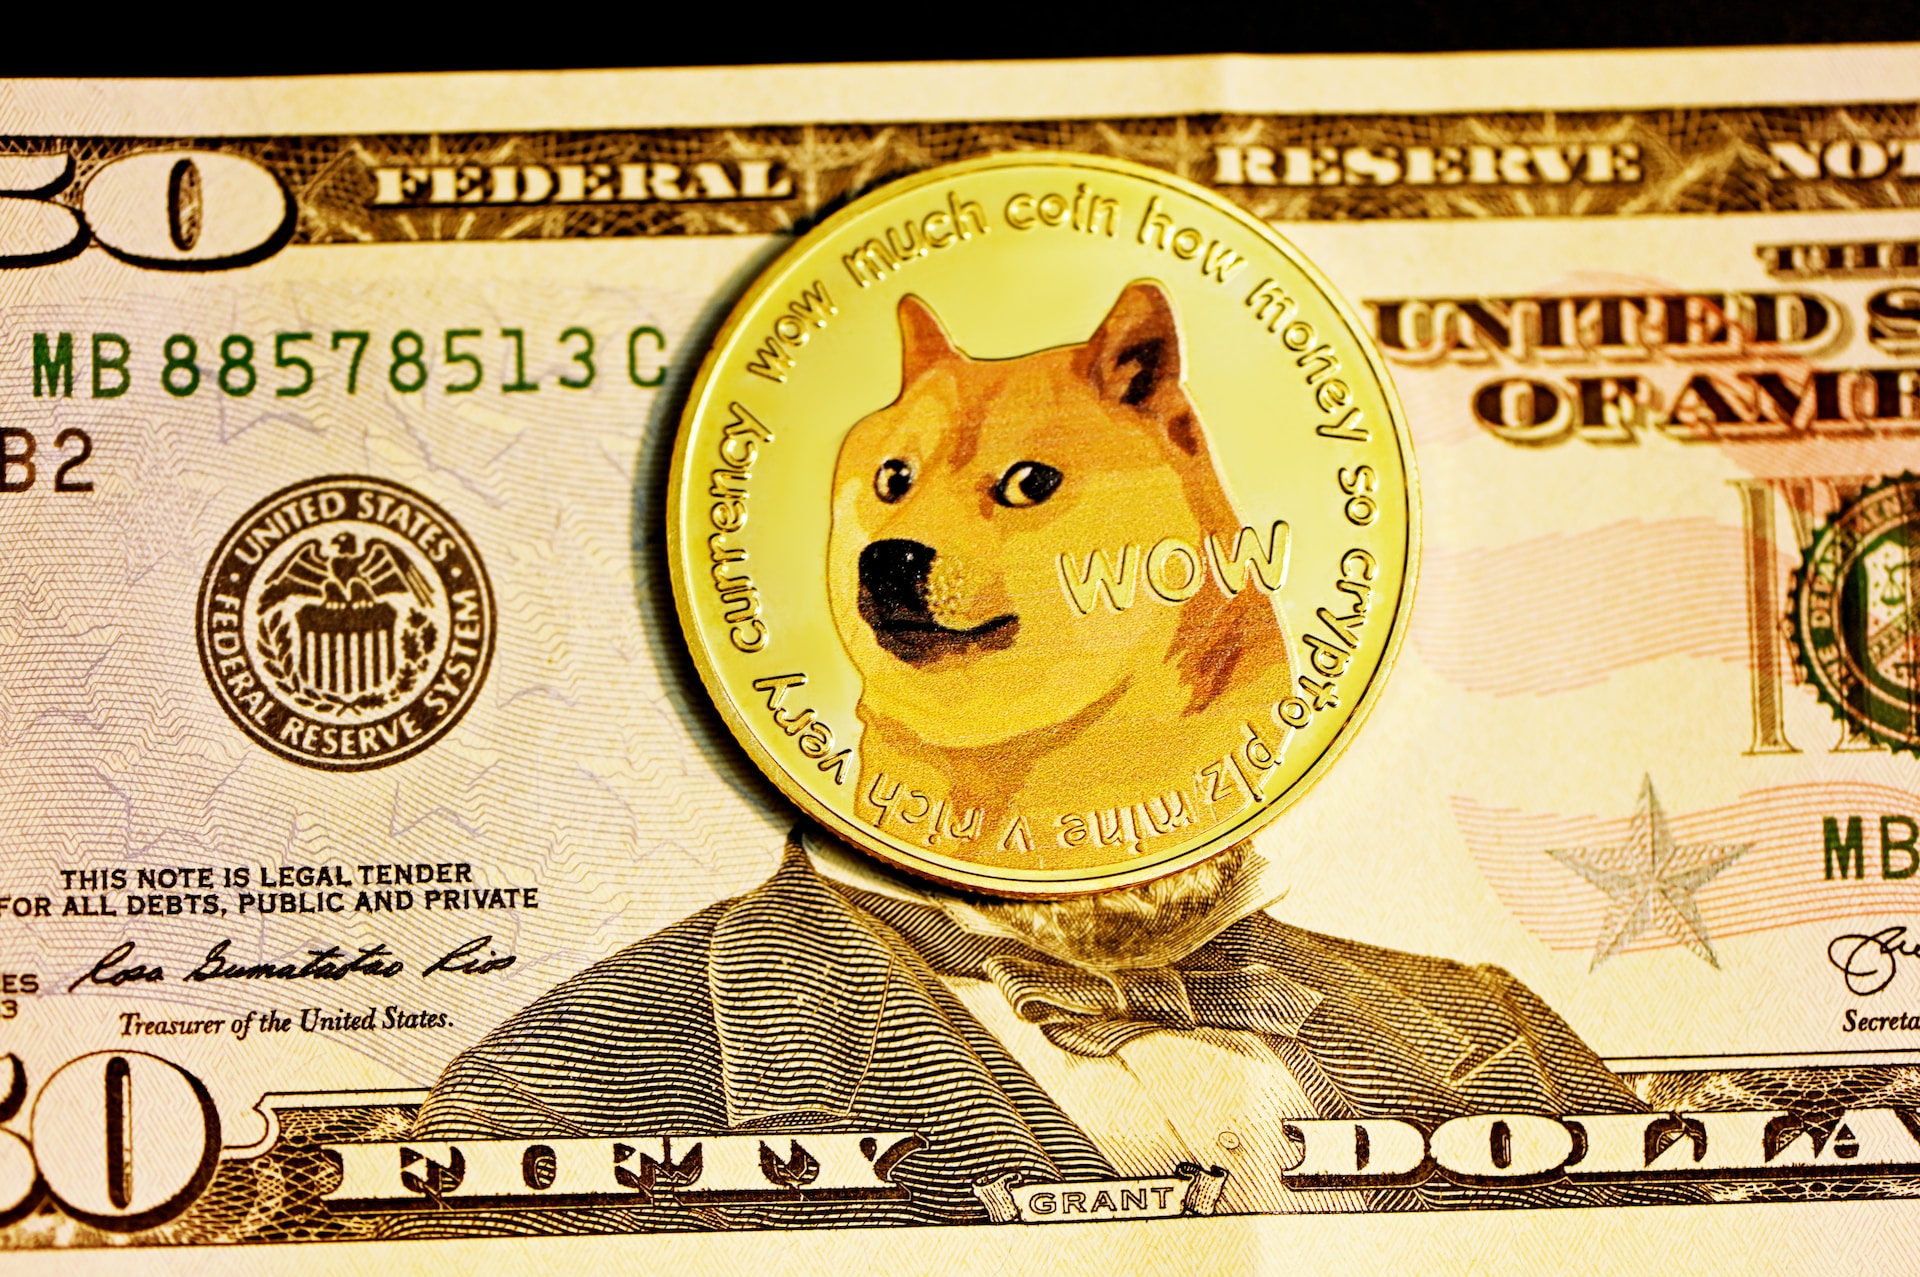
Dogecoin Suffers Price Drop Amidst Rising Popularity of PEPE Coin
Dogecoin has been experiencing a downward trend in its price dynamics in recent weeks, primarily due to the rise of PEPE coin, which has overshadowed its popularity. In the last 24 hours, DOGE has shown limited upward movement, with a rise of only 1%. This meme-coin has experienced a significant price drop, indicating a prevailing downtrend control.
The technical outlook for Dogecoin shows that bears are currently influencing its price. Both demand and accumulation have decreased, indicating a decline in buying activity. Moreover, Bitcoin’s rejection at $27,000 has harmed major altcoins, including Dogecoin, leading to a decline in their respective charts.
In order for Dogecoin to maintain its position above its immediate support level, it needs a recovery of buying power. If it fails to do so and loses its current support level, there could be further significant value loss before any signs of recovery emerge. Moreover, the decline in Dogecoin’s market capitalization at the time of writing suggests that buying power is waning.
Dogecoin Price Analysis: One-Day Chart
The price of Dogecoin on the one-day chart was at $0.07. The meme-coin had difficulty recovering after facing rejection at $0.076, and bulls have not been able to gain momentum. The current overhead resistance for DOGE is at $0.073. If this level is breached, it could push the meme-coin to $0.078. However, if the price falls from its current level, it is likely to reach $0.068 and possibly drop further to $0.066, causing a value loss of nearly 6%. DOGE’s trading volume in the last session showed a red signal, indicating increasing selling pressure.
Technical Analysis
For the most part of the month, demand for the meme-coin remained low. This was evident from the Relative Strength Index (RSI) staying below the 40 mark and nearly reaching the 30 mark, indicating oversold conditions. Furthermore, the asset’s price remained consistently below the 20-Simple Moving Average line, suggesting that sellers were behind the market’s price dynamics.
During the whole month, DOGE lacked positive demand, and its chart showed sell signals. The Moving Average Convergence Divergence (MACD), which indicates price dynamics and reversals, formed red histograms below the midpoint. This signals a sell signal, indicating a possible price drop in the upcoming trading sessions. The Bollinger Band indicator has expanded in terms of price volatility and fluctuations, suggesting that DOGE could experience price swings in the next trading session. To recover soon, Dogecoin heavily relies on the strength of the broader market.
Featured Image from UnSplash, Charts from TradingView.com
